
Is climate change to blame for the recent weather disasters? 2 things you need to understand
AP Photo/Alessandra Tarantino
Scott Denning, Colorado State University
Summer isn’t even half over, and we’ve seen heat waves in the Pacific Northwest and Canada with temperatures that would make news in Death Valley, enormous fires that have sent smoke across North America, and lethal floods of biblical proportions in Germany and China. Scientists have warned for over 50 years about increases in extreme events arising from subtle changes in average climate, but many people have been shocked by the ferocity of recent weather disasters.
A couple of things are important to understand about climate change’s role in extreme weather like this.
First, humans have pumped so much carbon dioxide and other planet-warming greenhouse gases into the atmosphere that what’s “normal” has shifted.
Second, not every extreme weather event is connected to global warming.
Shifting the bell curve
Like so many things, temperature statistics follow a bell curve – mathematicians call these “normal distributions.” The most frequent and likely temperatures are near the average, and values farther from the average quickly become much less likely.
All else being equal, a little bit of warming shifts the bell to the right – toward higher temperatures. Even a shift of just a few degrees makes the really unlikely temperatures in the extreme “tail” of the bell happen dramatically more often.
The stream of broken temperature records in the North American West lately is a great example. Portland hit 116 degrees – 9 degrees above its record before the heat wave. That would be an extreme at the end of the tail. One study determined the heat wave would have been “virtually impossible” without human-caused climate change. Extreme heat waves that were once ridiculously improbable are on their way to becoming more commonplace, and unimaginable events are becoming possible.
The width of a bell curve is measured by its standard deviation. About two-thirds of all values fall within one standard deviation of the average. Based on historical temperature records, the heat wave in 2003 that killed more than 70,000 people in Europe was five standard deviations above the mean, so it was a 1 in 1 million event.
Without eliminating emissions from fossil fuels, heat like that is likely to happen a few times a decade by the time today’s toddlers are retirees.
So, is climate change to blame?
There’s a basic hierarchy of the extreme events that scientific research so far has shown are most affected by human-caused climate change.
At the top of the list are extreme events like heat waves that are certain to be influenced by global warming. In these, three lines of evidence converge: observations, physics and computer model simulations that predict and explain the changes. At the bottom of the list are things that might plausibly be caused by rising levels of greenhouse gases but for which the evidence is not yet convincing. Here’s a partial list.
1) Heat waves: Studies show these are certain to increase dramatically with global warming, and indeed that’s exactly what we’re observing.
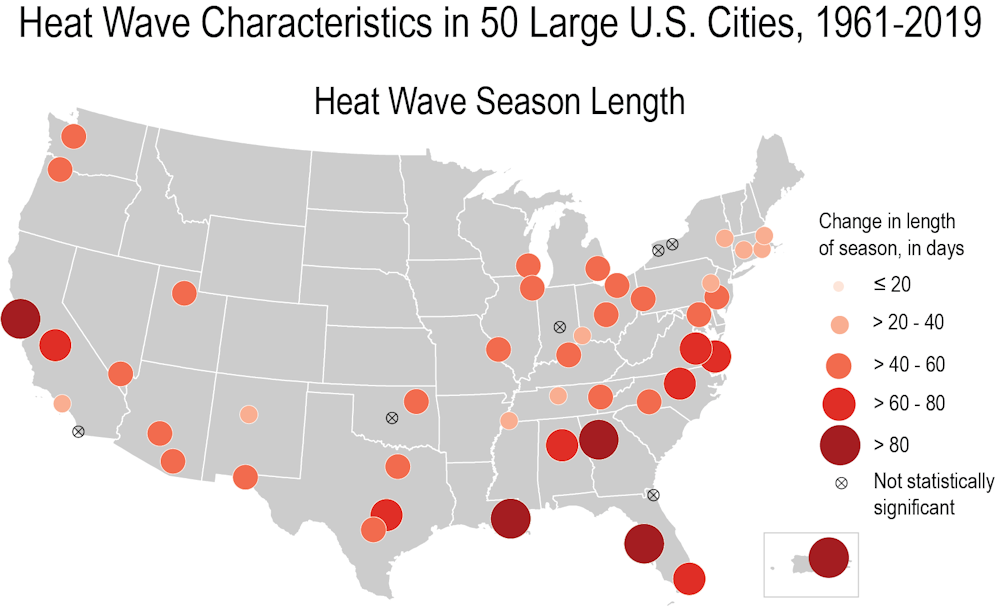
Michael Kolian/U.S. Global Change Research Program
2) Coastal flooding: Heat is causing ocean waters to expand, pushing up sea levels and melting ice sheets around the world. Both high-tide flooding and catastrophic storm surge will become much more frequent as those events start from a higher average level because of sea level rise.
3) Drought: Warmer air evaporates more water from reservoirs, crops and forests, so drought will increase because of increased water demand, even though changes in rainfall vary and hard to predict.
4) Wildfires: As the western U.S. and Canada are seeing, heat dries out the soils and vegetation, providing drier fuel that’s ready to burn. Forests lose more water during hotter summers, and fire seasons are getting longer.
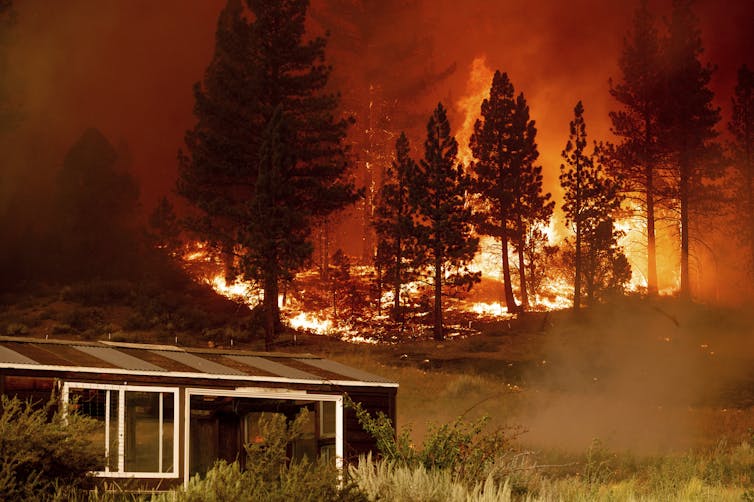
AP Photo/Noah Berger
5) Reduced spring snowpack: Snow starts accumulating later in the fall, more water is lost from the snowpack during winter, and the snow melts earlier in the spring, reducing the flush of water into reservoirs that supports the economies of semiarid regions.
6) Very heavy rainfall: Warmer air can transport more water vapor. Damaging rainstorms are due to strong updrafts that cool the air and condense the vapor as rainfall. The more water is in the air during a strong updraft, the more rain can fall.
7) Hurricanes and tropical storms: These derive their energy from evaporation from the warm sea surface. As oceans warm, larger regions can spawn these storms and provide more energy. But changes in winds aloft are expected to reduce hurricane intensification, so it’s not clear that global warming will increase damage from tropical storms.
8) Extreme cold weather: Some research has attributed cold weather than moves south with the meandering of the jet stream – sometimes referred to as “polar vortex” outbreaks – to warming in the Arctic. Other studies strongly dispute that Arctic warming is likely to affect winter weather farther south, and this idea remains controversial.
9) Severe thunderstorms, hail and tornadoes: These storms are triggered by strong surface heating, so it’s plausible that they could increase in a warming world. But their development depends on the circumstances of each storm. There is not yet evidence that the frequency of tornadoes is increasing.
A warning that can’t be ignored
The catastrophic impacts of extreme weather depend at least as much on people as on climate.
The evidence is clear that the more coal, oil and gas are burned, the more the world will warm, and the more likely it will be for any given location to experience heat waves that are far outside anything they’ve experienced.
Disaster preparedness can quickly fail when extreme events blow past all previous experience. Portland’s melting streetcar power cables are a good example. How communities develop infrastructure, social and economic systems, planning and preparedness can make them more resilient – or more vulnerable – to extreme events.
This article was updated to fix a typo, air as opposed to water, in the sixth item of the list.
Scott Denning, Professor of Atmospheric Science, Colorado State University
This article is republished from The Conversation under a Creative Commons license. Read the original article.


Views: 4
0
0
Share This
Read Time:8 Minute, 57 Second
IPCC climate report: Profound changes are underway in Earth’s oceans and ice – a lead author explains what the warnings mean
What might seem like small changes, like a degree of warming, can have big consequences.AP Photo/John McConnico
Robert Kopp, Rutgers University
Humans are unequivocally warming the planet, and that’s triggering rapid changes in the atmosphere, oceans and polar regions, and increasing extreme weather around the world, the Intergovernmental Panel on Climate Change warns in a new report.
The IPCC released the first part of its much anticipated Sixth Assessment Report on Aug. 9, 2021. In it, 234 scientists from around the globe summarized the current climate research on how the Earth is changing as temperatures rise and what those changes will mean for the future.
We asked climate scientist Robert Kopp, a lead author of the chapter on Earth’s oceans, ice and sea level rise, about the profound changes underway.
What are the IPCC report’s most important overall messages in your view?
At the most basic level, the facts about climate change have been clear for a long time, with the evidence just continuing to grow.
As a result of human activities, the planet is changing at a rate unprecedented for at least thousands of years. These changes are affecting every area of the planet.
Humans produce large amounts of greenhouse gas emissions, primarily through fossil fuel burning, agriculture, deforestation and decomposing waste.IPCC Sixth Assessment Report
While some of the changes will be irreversible for millennia, some can be slowed and others reversed through strong, rapid and sustained reductions in greenhouse gas emissions.
But time is running out to meet the ambitious goal laid out in the 2015 international Paris Agreement to limit warming to well below 2 degrees Celsius above preindustrial levels (2 C equals 3.6 degrees Fahrenheit). Doing so requires getting global carbon dioxide emissions on a downward course that reaches net zero around or before 2050.
What are scientists most concerned about right now when it comes to the oceans and polar regions?
Global sea level has been rising at an accelerating rate since about 1970, and over the last century, it has risen more than in any century in at least 3,000 years.
In the years since the IPCC’s Fifth Assessment Report in 2013 and the Special Report on the Ocean and Cryosphere in a Changing Climate in 2018, the evidence for accelerating ice sheet loss has become clearer.
Over the last decade, global average sea level has risen at a rate of about 4 millimeters per year (1.5 inches per decade). This increase is due to two main factors: the melting of ice in mountain glaciers and at the poles, and the expansion of water in the ocean as it takes up heat.
Ice sheets in particular are primarily responsible for the increase in the rate of sea level rise since the 1990s. There is clear evidence tying the melting of glaciers and the Greenland Ice Sheet, as well as ocean warming, to human influence. Sea level rise is leading to substantial impacts on coastal communities, including a near-doubling in the frequency of coastal flooding since the 1960s in many sites around the world.
Since the previous reports, scientists have made substantial advances in modeling the behavior of ice sheets. At the same time, we’ve been learning more about ice sheet physics, including recognizing the potential ways ice sheets can become destabilized. We don’t well understand the potential speed of these changes, but they have the potential to lead to much more rapid ice sheet loss if greenhouse gas emissions grow unchecked.
These advances confirm that sea level is going to continue to rise for many centuries to come, creating an escalating threat for coastal communities.
Sea level change through 2050 is largely locked in: Regardless of how quickly nations are able to lower emissions, the world is likely looking at about 15 to 30 centimeters (6 to 12 inches) of global average sea level rise through the middle of the century.
But beyond 2050, sea level projections become increasingly sensitive to the world’s emissions choices. If countries continue on their current paths, with greenhouse gas emissions likely to bring 3-4 C of warming (5.4-7.2 F) by 2100, the planet will be looking at a most likely sea level rise of about 0.7 meters (a bit over 2 feet). A 2 C (3.6 F) warmer world, consistent with the Paris Agreement, would see lower sea level rise, most likely about half a meter (about 1.6 feet) by 2100.
The IPCC’s projections for global average sea level rise in meters with higher-impact pathways and the level of greenhouse gas emissions.IPCC Sixth Assessment Report
What’s more, the more the world limits its greenhouse gas emissions, the lower the chance of triggering instabilities in the polar ice sheets that are challenging to model but could substantially increase sea level rise.
Under the most extreme emissions scenario we considered, we could not rule out rapid ice sheet loss leading to sea level rise approaching 2 meters (7 feet) by the end of this century.
Fortunately, if the world limits warming to well below 2 C, it should take many centuries for sea level rise to exceed 2 meters – a far more manageable situation.
Are the oceans or ice nearing any tipping points?
“Tipping point” is a vague term used in many different ways by different people. The IPCC defines tipping points as “critical thresholds beyond which a system reorganizes, in a way that is very fast or irreversible” – for example, a temperature rise beyond which climate dynamics commit an ice sheet to massive loss.
Because the term is so vague, the IPCC generally focuses on characteristics of changes in a system – for example, whether a system might change abruptly or irreversibly – rather than whether it fits the strict dynamic definition of a “tipping point.”
One example of a system that might undergo abrupt changes is the large-scale pattern of ocean circulation known as the Atlantic Meridional Overturning Circulation, or AMOC, of which the Gulf Stream is part. Paleoclimate evidence tells us that AMOC has changed rapidly in the past, and we expect that AMOC will weaken over this century. If AMOC were to collapse, it would make Europe warm more slowly, increase sea level rise along the U.S. Atlantic coast, and shift storm tracks and monsoons. However, most evidence indicates that such a collapse will not happen in this century.
The Gulf Stream is part of the Atlantic Meridional Overturning Circulation. A slowdown would affect temperature in Europe and sea level rise along the U.S. East coast.IPCC Sixth Assessment Report
There is mixed evidence for abrupt changes in the polar ice sheets, but clear evidence that changes in the ice sheets can be locked in for centuries and millennia.
If the world succeeds in limiting warming to 1.5 C (2.7 F), we expect to see about 2-3 meters (7-10 feet) of sea level rise over the next 2,000 years; if the planet continues to warm and reaches a 5 C (9 F) increase, we expect to see about 20 meters (70 feet) over the next 2,000 years.
Some people also discuss summer Arctic sea ice – which has undergone substantial declines over the last 40 years and is now smaller than at any time in the past millennium – as a system with a “tipping point.” However, the science is pretty clear that there is no critical threshold in this system. Rather, summer Arctic sea ice area decreases roughly in proportion to the increase in global temperature, and if temperature were stabilized, we would expect sea ice area to stabilize also.
What do scientists know now about hurricanes that they didn’t realize when the last report was written?
Since the last IPCC assessment report in 2013, there has been increasing evidence that hurricanes have grown more intense, and intensified more rapidly, than they did 40 years ago. There’s also evidence that hurricanes in the U.S. are moving more slowly, leading to increased rainfall.
However, it’s not clear that this is due to the effects of greenhouse gases – reductions in particulate pollution have also had important effects.
[Over 100,000 readers rely on The Conversation’s newsletter to understand the world. Sign up today.]
The clearest effect of global warming is that a warmer atmosphere holds more water, leading to more extreme rainfall, like that seen during Hurricane Harvey in 2017. Looking forward, we expect to see hurricane winds and hurricane rains continue to increase. It’s still unclear how the overall number of hurricanes will change.
The report involved 234 scientists, and then 195 governments had to agree on the summary for policymakers. Does that broad range of views affect the outcome?
When you’re writing a report like this, a key goal for the scientists is to accurately capture points of both scientific agreement and scientific disagreement.
For example, with respect to ice sheet changes, there are certain processes on which there is broad agreement and other processes where the science is still emerging and there are strong, discordant views. Yet knowing about these processes may be crucially important for decision-makers trying to manage risk.
That’s why, for example, we talk not only about most likely outcomes, but also about outcomes where the likelihood is low or as-yet unknown, but the potential impacts are large.
A scientist plants a flag to identify a GPS position on Greenland’s Helheim Glacier in 2019. The glacier had shrunk about 6 miles (10 kilometers) since scientists visited in 2005.AP Photo/Felipe Dana
The IPCC uses a transparent process to produce its report – the authors have had to respond to over 50,000 review comments over the three years we’ve spent writing it. The governments also weigh in, having to approve every line of a concise Summary for Policy Makers that accurately reflects the underlying assessment – oftentimes making it clearer in the process.
I’m very pleased that, as with past reports, every participating government has signed off on a summary that accurately reports the current state of climate science.
Read more:The water cycle is intensifying as the climate warms, IPCC report warns – that means more intense storms and flooding
Robert Kopp, Professor, Department of Earth & Planetary Sciences, and Director, Rutgers Institute of Earth, Ocean, and Atmospheric Sciences, Rutgers University
This article is republished from The Conversation under a Creative Commons license. Read the original article.
Is climate change to blame for the recent weather disasters?
Share
Share ThisRelated Posts:Reduce Litter and Protect the OceansHow to eat for a better Earth50th anniversary of Earth Day means todayBlack Rock City the most unusual town on Earth.Watching a coral reef die as climate change…